

Coming back with another bcn map. this time I’m not representing anything from open data, but I’m playing around the network analysis tool available with Qgis. The following distances map has been generated using those tools:

Base Data
The base data comes from OSM, using OSMDownloader it’s easy to download a set of Barcelona data as vector data. This will be our network. No further processing has been applied, so take all the analysis with a grain of salt.
OSMDowlonader gets all data in OSM for a given bounding box. For the map I’ve used the clipping tool to limit the vector layer within the Barcelona city limits, and filtered only by roads (I’ve no need for buildings or POIs).
QGis network tools
Newest Qgis versions provide some network tools, which are very easy to use as they can be called directly from the geoprocessing toolbar:

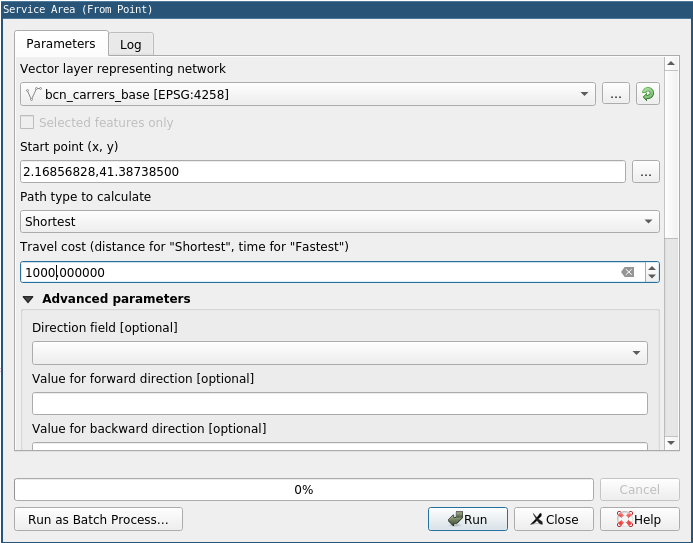
For my objective (distance from the center of Barcelona), I’m using the service area from a single point. 2.16856828,41.38738500 (more or less Plaça de Catalunya). This will be an iterative process, changing inputs from 1000m distances up to 10000m distances (1 to 10 km).
The Service area is self-explanatory. Select the vector layer representing network, in this case Barcelona streets as presented in OSM. The start point (2.16856828,41.38738500), our provided distance (1000 m) and the processing mode (distance). We’re using distance instead of speed in this case.
Some extra options are available, mostly to restrict the network graph. For this simple case we assume all segments can be traversed in both ways because I’m assuming somebody walking.
That’s mostly really it. For example, the 5km layer will look like this:

Layer positioning is important since we want the shorter layers to visually “overwrite” the longer ones.

After repeating this process 10 times we finally have the different layers with different distances.

The colorscheme used is the 9-class RdPu from colorbrewer2 using the maximum 9 steps. The 9th step is changed a bit so we can actually add the 10th step that covers all Barcelona. So, from any given point in the city you have at maximum a 10km walk to the center 🙂
Labeling
From the OSM downloaded data we have the names of all Barcelona streets. If we activate labels for the whole layer chaos will ensure.
For this task I created a new plain line layer with the main streets of Barcelona that I want to highlight using the base layer as a template. On this new layer is where the labels are activated so at the end we have only 5 main streets present on the map.


This final Layer is the one on top of the network map, so you have a little bit of context of the city.
Network Allocation
Since I was already messing with it I wanted to do something similar to the network analysis done with GRASS so long ago.
I was unable to find a way to allocate a network using plain QGis, but since GRASS tools are nicely integrated we can directly call v.net.alloc from Qgis.
For the test I dropped a layer of hospitals of Barcelona, and filtered by CAPs (Primary assistance):

This was clearly easier than running it from GRASS. Take into account that the provided network is not clean and it would need to be cleaned-up for a proper analysis. For example, some CAPs connect to a motorway instead of the street, giving strange results.
The colorscheme used is a random one too (not much thought put into it), so some areas that are actually different appear with similar colour.
Conclusion
You can now do some basic network allocation directly from Qgis without any special plugin loaded in, while also accessing a wide set of GRASS tools to work with, it’s easy to create a small representation be it distances or speed, find shortest paths and service areas for a given distance.
One of the bases for a good run of any algorithm its a good dataset. In this case I’m using plain Open Street Map data without much thought, which leads to some strange results in the GRASS v.net.alloc run. More work would be needed to actually obtain fully valid input datasets. Probably ensure that each point connects to their real life street (no hospital connects directly to underground tunnels for example), and double check areas that had weird results, maybe a street is not properly connected in the original dataset.
Finally, another of my small visualizations of data in Barcelona. Seems I’ve been on a roll doing those, probably because I enjoy doing them :-D.
