

Here I am again, this time with something that I love, trees!
It’s mostly common knowledge that the tree of Barcelona is the Platanus (bear with me with tree names, since the names in english confuse me most of the time 🙂 ). I’ve been looking for an excuse to dive back to Barcelona open data, and to create a hex-grid-map.
For this two images, I’ve used the street trees dataset, which only takes into account trees planted along streets, parks and green zones are not taken into account.
And from this excuse, two new data visualizations emerged!
Number of Trees
This first one is an hex map of roughly 100m on each diagonal counting how many trees fall within each hexagon. Most of the hexagons have at least 10 trees, and some areas have a huge amount of them (not many though).
This would make sense, since those are trees in the streets I expect to see a fairly spread over the city, which seems to be the case since most of the area is covered by light-greenish hexagons, meaning that trees are quite present. While in the old-city area we can see less trees available (yellow and no-color).

Here’s an overlay indicating what are the big empty spaces. As commented before, the dataset contains only street-trees, so parks are left out grey. Although those areas would probably be lush green, depending on the kind of park.

Tree Types
For the second map I increased the hex grid to a 4ha area (give or take) and classified each grid by the most common tree type within it. The results are extremely varied, so the map simply shows 10 types (the top 9 trees, and the rest of the areas as “other”).
Since I’m not too good with tree naming in English, I just kept the Catalan names in the map (alongside the scientific name)
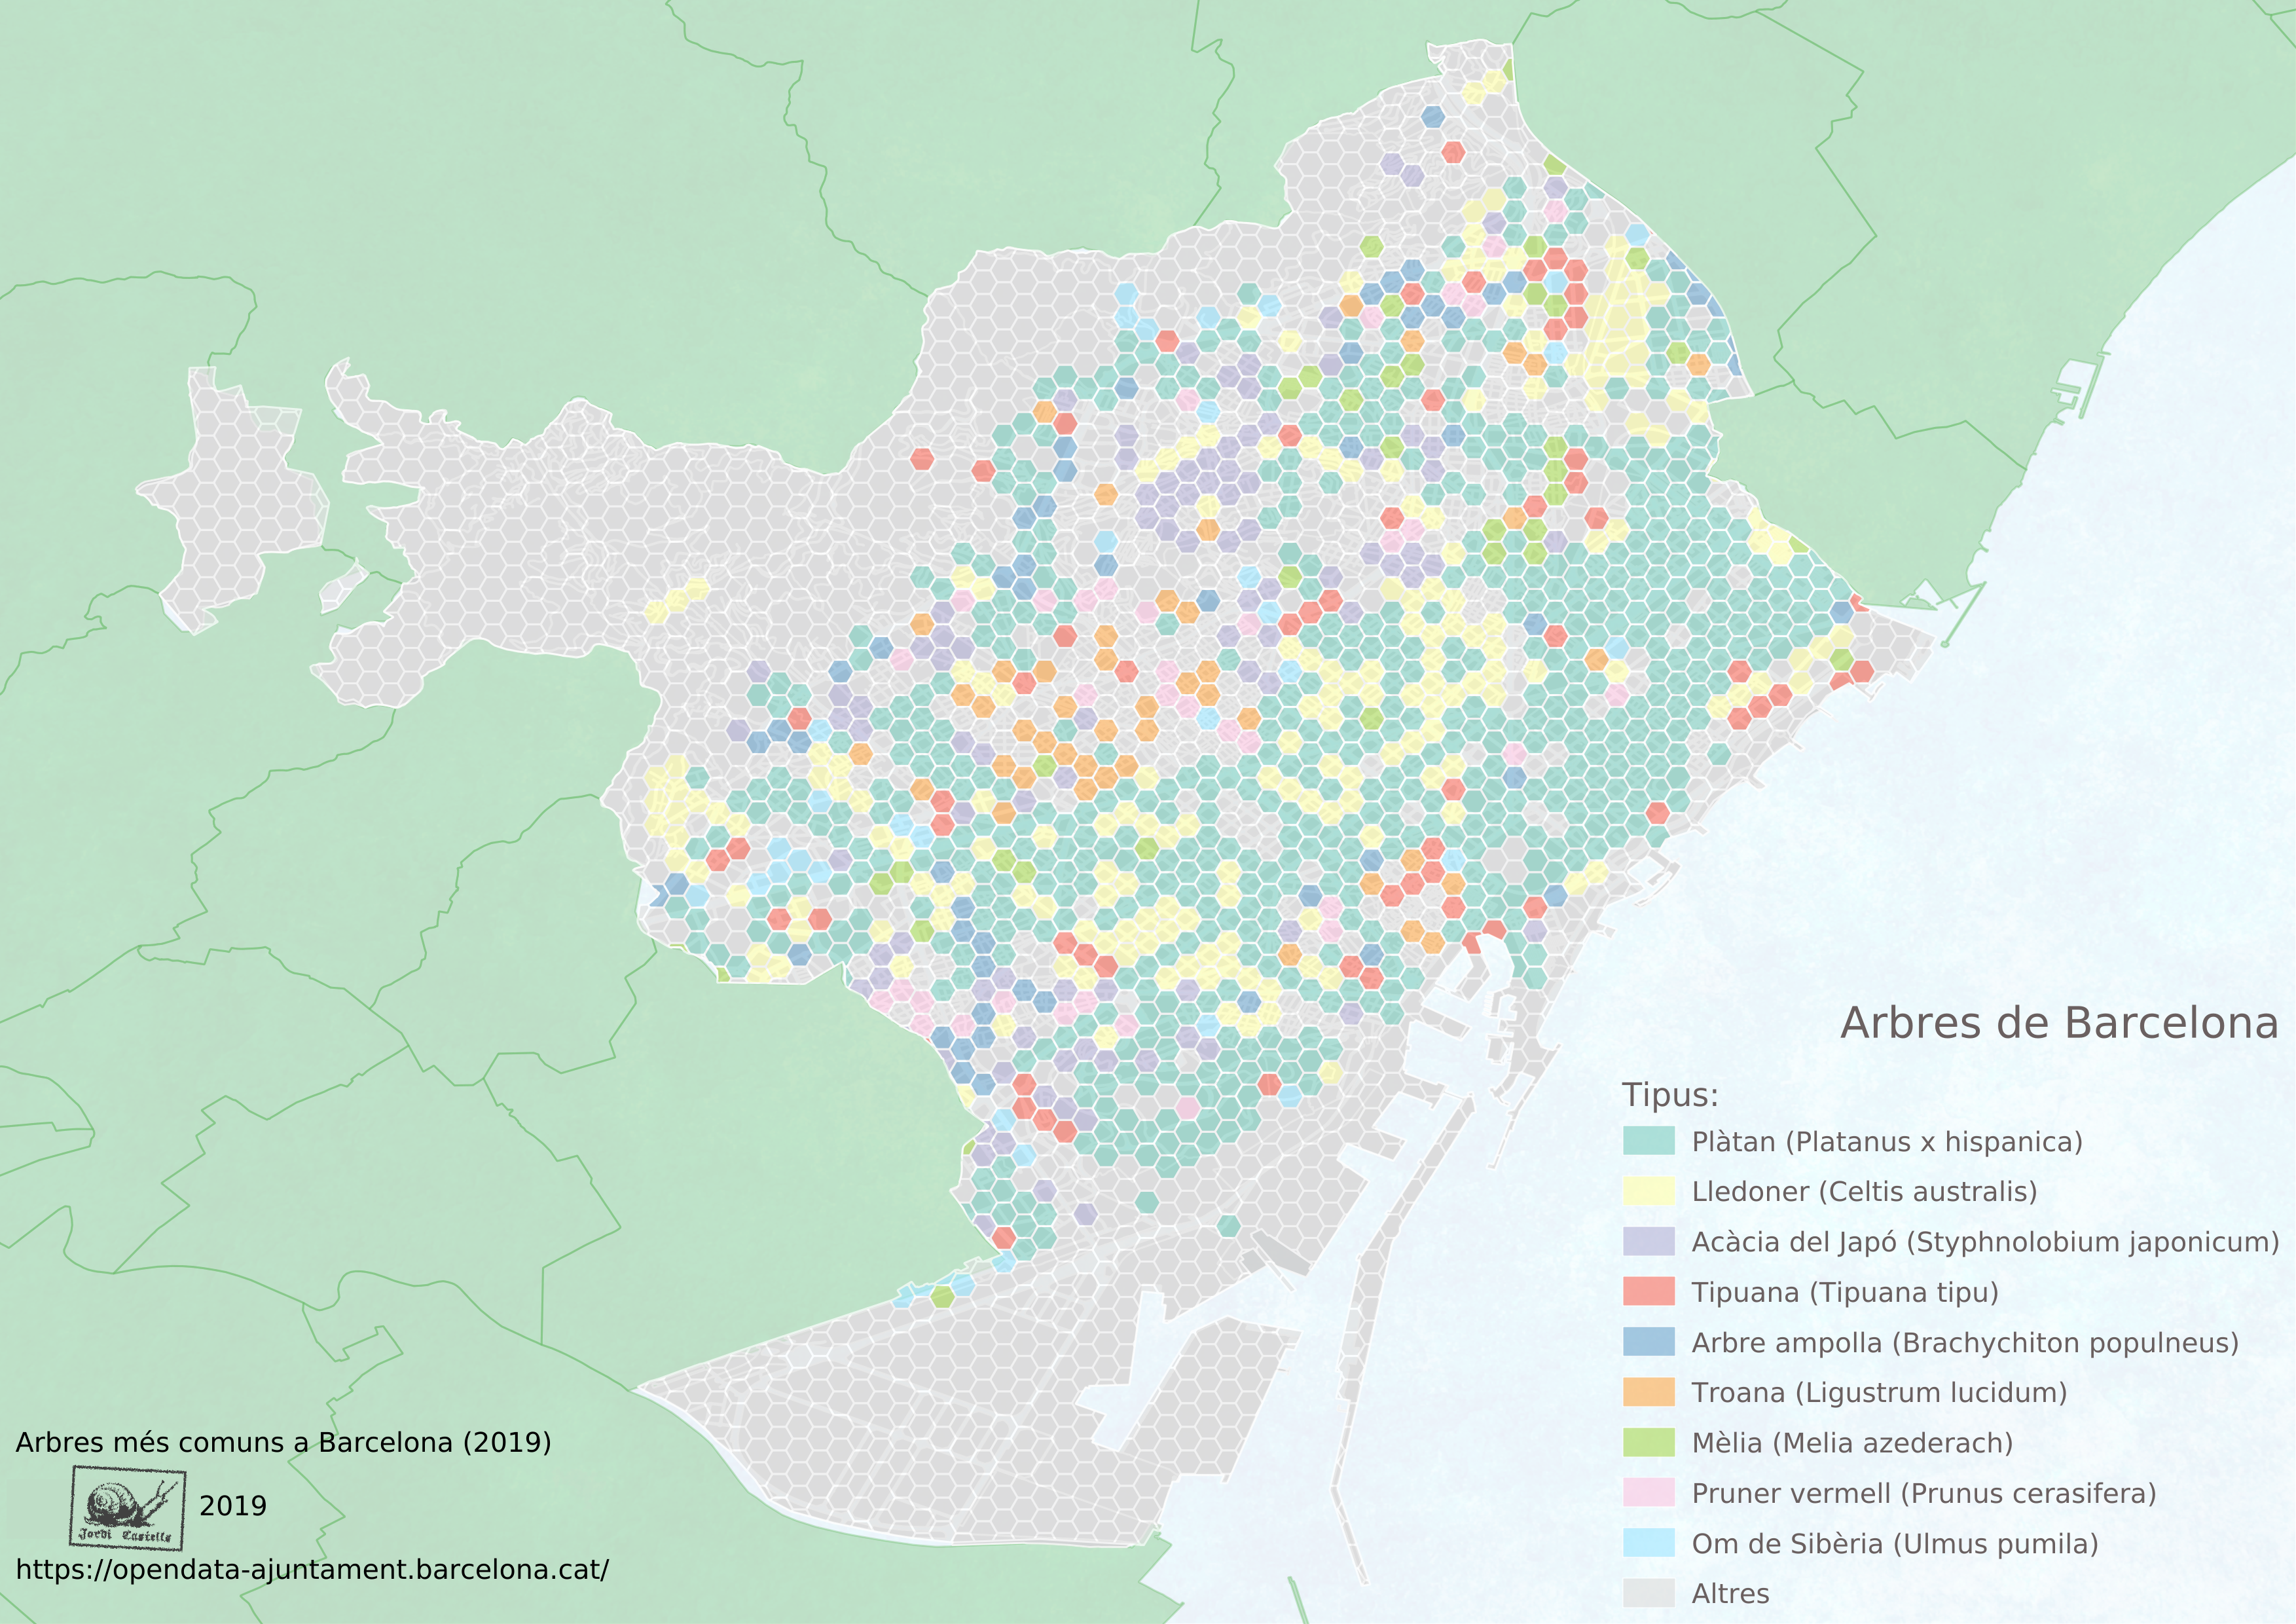
Those are the top 3 trees that you can find in Barcelona:
- Platanus (588 cells)
- Celtis australis (196 cells)
- Styphnolobium japonicum(101 cells)
So, I can confirm, Platanus is everywhere. Second one (Celtis australis) does not surprise me neither, since it’s a common mediterranean tree (afaik). But the third one apparently is a chinese/japanese variant, it’s at least curious that it appears as one of the most widely available trees. Although, if you check the provided map, most of the area is covered in Platanus and Celtis australis.
Missing trees
There’s a second complementary dataset that I did not merge in my original data, which means that some areas are not taking into consideration those second dataset trees.
| Dataset | Number of trees |
|---|---|
| arbrat_viari.csv | 156600 |
| arbrat_zona.csv | 46968 |
Most of those trees are not park related trees, but for example wider areas also handled by the municipality which lie next to the street, those are neither considered streets nor parks.
The following heatmap shows which hexagons would be more affected if the two datasets were joined and the process repeated:

Other visualizations
I’ve found another visualization in form of interactive map by Juanjo Vidal which lets you navigate the map of Barcelona clicking each point to get information on each tree. I thought to link it here since it’s the same dataset 🙂
Conclusions
Striking back with another short post about some visualizations of Barcelona data. That website is always interesting to have a look at, new data keeps coming in and providing visualizations of those is simply fun.
I’m not providing the step-by-step instructions as I did in the past for some map generations: Europe DbPedia 2017 or Basic Network Analysis With GRASS, I might do in the future since this hexagon-grid mapping and classifying involves some extra interesting steps.
Anita already provides some posts on how to do so, so nothing really new to write about really 😀
References
Barcelona Series
Arbrat a Barcelona
Ja que parlo de Barcelona, he pensat que era una bona excusa d’escriure també en català 😛
És saber popular que l’arbre més corrent a Barcelona és el plàtan. Ja fa un temps que he estat buscant una excusa per tornar a entrar de cap a usar Barcelona open data, i també per crear un mapa hexagonal. Els arbres són la meva excusa, i d’aquí en sorgeixen dues visualitzacions diferents.
Nombre d’arbres
El primer mapa és un mapa hexagonal de més o menys 100m a cada diagonal.
A primera vista la majoria dels hexàgons tenen com a mínim 10 arbres, i algunes àrees tenen en una gran quantitat. Aquestes àrees principalment indiquen alguna de les rambles de la ciutat.
Ja que les dades d’origen són arbres al carrer és esperat trobar-ne un xic pertot arreu de Barcelona, sent una ciutat on a cada carrer en general pots trobar arbres a algun costat de la vorera. Sols a les àrees més al nord, el centre mateix, o la zona portuària podem veure una concentració molt baixa d’arbres. Òbviament tenim forats dins del mateix mapa, aquests es troben principalment als parcs, on els arbres no són considerats arbres viaris.
Tipus d’arbres
Pel segon mapa, he canviat la mida de l’hexàgon a més o menys 4ha, i classificat cada hexàgon amb el tipus d’arbre més comú a aquella àrea. Els resultats són molt variats, així que el mapa simplement mostra 10 tipus (el top 9 d’arbres i la resta classificada com “altres” )
Els top 3 d’arbres que pots trobar a Barcelona serien:
Confirmat, el plàtan és pertot arreu. El Lledoner també és un arbre comú del mediterrani (si no vaig errat). El tercer és l’únic que em genera certa sorpresa, ja que aparentment seria una variant Japonesa, com a mínim és curiós que aparegui com el tercer arbre més comú.
De totes maneres, observant el mapa és clar que el nombre total és molt reduït i la majoria d’hexàgons mostren lledoners o plàtans.
Altres visualitzacions
En acabar aquests mapes he trobat una visualització interactiva feta per Juanjo vidal, et permet navegar per tot Barcelona veient cada punt en detall. Com que és exactament el mateix set de dades el deixo linkat aquí com a curiositat.
Conclusions
Altre cop torno amb un post curtet sobre alguna visualització de Barcelona. Open Data Barcelona és un pou de dades interessants per visualitzar i tafanejar.
A diferència de posts anteriors (tots en anglés) sobre generacions de mapes: Europe DbPedia 2017 o Basic Network Analysis With GRASS no mostro pas a pas com els he generat. Podria fer-ho en el futur per aquest mapa en concret, ja que la generació de graelles hexagonals implica uns passos extres que poden ser interessants.
L’Anita ja té un petit escrit bastant antic sobre com fer-ho, així que tampoc seria res realment nou.
