

I am pleased to announce the DBPedia Places map. Since I wrote my master thesis about vague places I wanted to do something like this. The vague-places generator was one of the outputs of such work, but I felt the need to see DBpedia points on a map, changing every day.
The final result can be poked at the dbpediamap.tk, this post is an overview of how this small project works.
As a quick taste, here’s a screenshot showing a dataset presented on the website:

DBpedia viewer USA
Preamble
There is no one giant step that does it. It’s a lot of little steps.
★ In 2010 I worked at HYDS, learned about maps and coded a lot of Javascript.
★ In 2011 I programmedMaze! Pykurin and Survival. My first introduction to Python.
★ In 2012 I wrote the vague-places generator. It was good and it sat there until now.
★ In 2013 I worked at ARM. Read a lot of ARM assembler.
★ In 2014 I discovered Scaleaway cheap and small servers. I poked a little with an ARM server.
★ In 2016 I had a Christmas dinner with work colleagues. Drank a lot and the next morning I was free with no plan.
So let’s say that everything falls by its own weight :-D.
Objective
A map that presents points from DBpedia daily CSV dumps selectable by country.
Clear and concise right?
This post won’t be very exhaustive, but presents the whole idea.
There are similar things online already, like the Mapping Wikipedia website. But the scope is different. I just want to map articles related to places. And what is important are the points, not the articles themselves.
Powered By
- Python (vague-places git repo)
- Apache (Website and data listing)
- Scaleaway
- JQuery & Leaflet (The Online map itself)
That is mostly it. The big bite comes from organizing the backend part: Python scripts. Most of it was already written 4 years ago, and needed a little bit of coat paint to work with the latest live DBpedia and the small server that I’m using. The backend creates a set of CSV files, and the frontend reads those files directly from Apache listings (no REST service involved, although it might have been easier).
Backend
The backend flow is quite simple.
allDbPediaPoints.py.- Remove duplicates
filter_pointSet_by_country.py- Organize the output files.
alpha_shaper- Generate alpha shapes for each dataset.
allDbPediaPoints.py retrieves all DBpedia places. It does so by performing repeated SPARQL queries with different OFFSET and LIMIT values. With this approach we can avoid the limit response size, and spacing this queries I don’t attack DBpedia too harshly.
Since I do not check the results (just append), the resulting file has a lot of duplicates. I’m not sure if this is my fault or DBpedia dataset fault. But the easiest approach is to just remove those duplicates. The default set of UNIX tools and Bash are more than enough to do so:
cat datafile.csv | sort -u . (or sort -u directly)
Once the duplicates are removed a new script prepared for this small project comes into play. For a given points file I want to split it in different files, one for each dbo:Country. I was tempted to just use awk for this task. But the naming of the files proved troublesome (slashes, strange characters) and the awk line too confusing. Instead of that, a Python filtering script does the trick. The batch_country_dataset_generator.py program has to be careful, the server where it runs can be easily overrun if I just load everything into memory. Instead of the direct approach (loading everything in memory) this script traverses the full file two times.
- Traverse FILE to generate a list of countries.
- Open a file handler for each country.
- Traverse FILE copying the file to its own file.
This approach keeps the memory footprint low, and it does not affect the processing time.
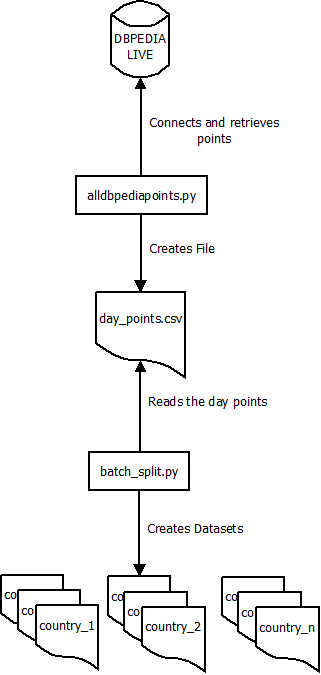
DBPedia map backend flow
Frontend
I never used leaflet directly and I was curious. That’s my only reason to use it instead of something that I’m more comfy with: OpenLayers.
Creating a map is really easy (check the Tutorials). But my main problem is that I’m not using GeoJSON but CSV files with WKT. Again, there is a library to solve this problem, and its name is omnivore (a very well thought name if you ask me). Omnivore can deal with CSV and WKT, but not both at the same time. CSV has to be a file with latitude and longitude, and a WKT layer comes from a single string. So of course, what I’ll do is parse the CSV files line by line in JS and create a layer for each one.
The following function parses a string containing a CSV file adding a point for each entry.
function processDataFile(allText) {
    var allTextLines = allText.split(/\r\n|\n/);
    var headers = allTextLines[0].split(';');
    var lines = [];

    for (var i=0; i<allTextLines.length; i++) {
        var data = allTextLines[i].split(';');
        if (data.length == headers.length) {
            var wkt = data[5]

            layer = omnivore.wkt.parse(wkt)
            l = L.circleMarker(layer.getLayers()[0]._latlng);
            l.setRadius(1.5);
            l.addTo(MAP)
        }
    }
}
Note that I start the loop at 0 instead of 1. I know that my files have no headers so there’s no need to skip the first line.
Speed was a problem when dealing with big datasets like Poland or United States. Reviewing the generated website it was clear to me that leaflet worked with HTML div constructs instead of canvas, and that’s not acceptable for the scope of this dataset. Easily enough, just changing the default Marker to a CirleMarker activates the canvas engine and everything is much smoother.
ScreenShots
I’m appending here some screenshots as a memento of this website. Since I don’t know how long will I be hosting this experiment.
Conclusions
Finally done, a small idea that I had in 2012 comes to fruition. I’m happy with the result and in the coming months I’ll be tweaking the small errors that (mark my words) inevitably will pop up.
Lots of names are not string friendly and I did not take it into account, the website presents very strange datasets amongst the real datasets. A cleanup of code and UNICODE support in all my operations may be the solution here.
I don’t present that in the website, but for a dataset of approximately 700.000 entries, the scripts dump 400 points that is unable to parse. Additionally some points are discarded because they belong to a dbo:Country with less than 3 points.
Preparing the website reminded me of how much different is web developing than my current area (Embedded). I’m able to work it out, but the JavaScript code gets messy and confusing very fast. I wanted to implement a searchable combobox (like the one on jquery-ui), when I saw that the code spanned all those lines the idea was scrapped, I wanted to keep it simple. A new iteration may include it.
References
Vague places github ⇒GO
Vague places original report ⇒GO
DBPedia ⇒GO
JQuery ⇒GO
Leaflet ⇒GO
Python ⇒GO
Apache ⇒GO

Pingback: The dropped posts, and 2017 closing | Castells