

For Module8, at ITC we have been learning about MapServer and OpenLayers. In my case, I also been playing with TileMill. Here I explain all the steps needed to create a small map with tilemill.
What is this?
As they say on their website, TileMill is an application for designing beautiful maps. It is a product of MapBox, a company that creates styling tools and provides map serving facilities.
Also, it has a very cute logo 🙂
TileMill uses three main components:
- Mapnik (LGPL)
- Carto
- Web Server
Mapnik
Mapnik is an open source toolkit for rendering maps. Basically: input files (using GDAL libraries) + XML configuration –> Image.
Carto
Carto is the language developed at MyBox that TileMill uses for styling the maps.
Web Server
Used for serving the result files locally to your tilemill.
TileMill is open source, and you can get the code at github
Hands On
The idea is to create a map with:
- Thailand different forest zones
- Railway Lines
- Airports
- Forest Legend
- onHover name of the Airport
>>Creating a new project
Easy as pie, just opening the application there are some example projects, one of the buttons is labeled “New project”

TileMill New Project
This will lead us to the new project dialog. Fill all the required information. Also, I would recommend adding the ‘Default Data’ layer, which contains the seas and the countries, so you already have a canvas to work on.
Once the project is created you will see it in the project list. It’s time to open it!
>>Adding all the data files
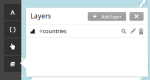
Ok. We have a project with the basic layers, but we want to cook something different. In this case, I have some shapefiles from Thailand, using the layers ( ) toolbar.

Layer "Toolbar" with countries layer loaded
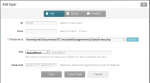
The layer list is self explanatory, once opened you only need to “add” the desired layers. The add dialog is also straightforward:

Add new layer dialog
Select the input data: Shapefiles ,PostGIS or SQLite. The Spatial Reference System is automatically detected and usually works correctly, but not always. Sometimes I needed to reproject a shapefile using Qgis.
A strange decision is the separation between Save and Save & Style. If you only save, the layer will be added but it won’t appear on the map because it has no style. On the other hand, save and style will create a default style for the layer and it will be rendered on the map screen.
For example for my Forest Layer, TileMill created a default style for it:
#forest {
   line-color:#594;
   line-width:0.5;
   polygon-opacity:1;
   polygon-fill:#ae8;
}
At this point you should be adding all your layers with default styling, leading to a very confusing and probably ugly map.
>>Styling Time!

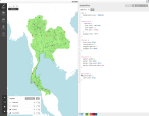
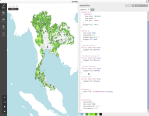
All Thailand layers with the default style
I’m going to be fast here, because…
Documentation is your friend
And will always be!.
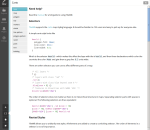
TileMill has the code reference in a handy place, just click the  button and BUM! here you can read all the possible styling options and how to use selectors

TileMill reference is extremely handy
For the forests, I know that the features have the attribute FOR_TYPE, so I create different colors for different selectors. You can check the attributes in the layers toolbox, using the inspect icon (shaped as a magnifier).
#forest {
  line-color:#594;
  line-width:0.5;
  polygon-opacity:0.7;
  polygon-fill:#ae8;
}

/*National Park*/
#forest [FOR_TYPE='NP']{
  polygon-fill:#65e61b;
}

/*Wildlife Sanctuary*/
#forest [FOR_TYPE='WS']{
  polygon-fill:#b2ec2a;
}

/*Forest Reserve*/
#forest [FOR_TYPE='FR']{
  polygon-fill:#3b9400;
}

/*NotForest*/
#forest [FOR_TYPE='NF']{
  polygon-fill:#eeeeee;
}
For the raiload:
#railroad {
  line-width:2;
  line-color:#000;
  line-dasharray: 2,2;
  line-opacity: 0.3;
}
Finally, for the airports I use an airport icon from the maki icon set.
Unpack the icon set and place the icons in the project directory. (Check TileMill Settings to know where is your project directory, in my case is ~/Documents/MapBox)
#airports {
  point-file: url(maki/airport-24.png);
}

All the layers once styled
>>Legend
I’m a little bit disappointed in how the legend works. I expected some kind of autogeneration from the shapefiles but not, totally manual without templates, only HTML and WAX.
I used the base code shown at TileMill advanced legends example only a little bit modified to fit the colors and the names.
The definition of the legend is at the templates section ( ). And BUM! a lot of code for something that should be really easy to do.
<div class='my-legend'>
<div class='title'>Forest Type, Airports and Railway</div>
<div class='scale'>
  <ul class='labels'>
    <li><span style='background:#65e61b;'></span>National Park</li>
    <li><span style='background:#b2ec2a;'></span>Wildlife Sanctuary</li>
    <li><span style='background:#3b9400;'></span>Forest Reserve</li>
    <li><span style='background:#eeeeee;'></span>Non Forest</li>
  </ul>
</div>
<div class='source'>Source: ITC Exercise Data</div>
</div>

<style type='text/css'>
  .wax-legend .title {
    text-align: left;
    margin-bottom: 5px;
    font-weight: bold;
    font-size: 90%;
    }
  .wax-legend .scale ul {
    margin: 0;
    margin-bottom: 5px;
    padding: 0;
    float: left;
    list-style: none;
    }
  .wax-legend .scale ul li {
    font-size: 80%;
    list-style: none;
    margin-left: 0;
    line-height: 18px;
    margin-bottom: 2px;
    }
  .wax-legend ul.labels li span {
    float: left;
    height: 16px;
    width: 30px;
    margin-right: 5px;
    margin-left: 0;
    border: 1px solid #999;
    }
  .wax-legend ul li span {
    display: block;
    margin-left: 0;
    }
  .wax-legend .source {
    font-size: 70%;
    color: #999;
    clear: both;
    }
  .wax-attribution a,
  .wax-legend a {
    color: #777;
    }
</style>
>>OnHover Naming
After the bitter taste of the legend, the onHover of features is a piece of cake.
In the same toolbar as the legend () there’s another tab called teaser.
In this screen we have a writing zone and a dropdown list. The dropdown list contains all the possible layers to query. When we select a layer TileMill shows us which Moustache tags we can use. (Let’s stop here. Moustache tags! That’s an awesome name!).
All the feature attributes are accessible by its name between three moustaches on each side, for example {{{NAME}}}. Moustache Templates can also be used.
Really easy code:
AirportID: {{{ID}}} <br/>;
Name: {{{NameEnglis}}} <br/>;
>>Configure BBOX and Zooms
We have all the layers styled, a legend and onhover feedback. To export image files we are done, but if we want to export MBTiles or update our map to MapBox we need to perform another step.
Next to the save/export there’s the project configuration button (with a spanner as almost all configuration buttons in the world). On the configure toolbar we can modify the name, description, version etc… but also the Bounding box and the zoom levels.
This two parameters are very important as they are directly related to the size of the project.
The bigger the extent (bbox) –> more image tiles –> more size.
More zoom levels –> more image tiles –> more size.
It is important then to decide what is the important extension for our project. In Thailand case, I decided a bounding box around Thailand (shift click on the map to draw the rectangle).
Also, note that you should use zoom levels that are relevant to your map. I don’t need the zoom level 1 because the result is a mesh of colors, neither the zoom level 20, because a zoom level bigger than 10 (given the resolution of the data) is pointless.
Decide and save the settings!
>>Exports
Finally!
Export options:
- Upload
-
- PNG
- SVG
- MBTiles
- Mapnik XML
Everything is pretty clear except maybe MBTiles and Mapnik XML. Mapnik XML can be used to style the data directly using mapnik. MBTiles is the tile format used for MapBox.
If you create a free account at MapBox, the map can be directly uploaded and shared from there. The Thailand map example can be accessed there: Online Map at MapBox.
I would love to embed the map here, but wordpress.com does not allow the <iframe> tag for security reasons.
>>Final Thought
If you read this far, congratulations! I planned a small post, but life is never what you expect.
In this post I explained what is TileMill and how to start working with it. I have to say that this has been a “stupid” effort because the documentation at TileMill website is really good! 🙂
-

- TileMill New Project
-
- Layer “Toolbar” with countries layer loaded
-
- Add new layer dialog
-
- TileMill reference is very handy

-
- All Thailand layers with the default style
-
- All the layers once styled

Thanks for writing this. I agree that Tilemill doc is very clear and beautiful, but it’s always usefull to have serveral point of views and different formulations.
What is unclear to me, is about mapbox hosting.
Say I want to create a custom map, in the whole world, until zoom 14, then (according to tilemill), I need 100Gb+ to host this? Which means even their most expensive plan doesn’t offer this.
So what are our options when designing a world map (besides less zoom)?
Thanks
Hi,
Yes, the free account on MapBox is not very fancy, but hey, it’s free.
Upfront: I am not going to solve your problem with mapbox 😛 but talk about it a little.
You have to count how many tiles are generated, and that each tile is probably about 40KB, 100GB accounts for… 2 million of tiles?
I only see two options: Either reduce your tileset (less zoom, less extent), or reduce the image quality.
There is no magic recipe for this, lots of data => lots of space. But probably you can perform some tricks.
1st coming to my head, The earth is full of water, you don’t need thousands of tiles of water 🙂 one or two should suffice.
2nd Do you really need the last zoom level? that accounts for more than half the dataset, and it is a very detailed level.
Good Luck!
Hey,
Thanks for your support ! 🙂
I agree that its math, the many tiles mean much data. But what suprises me is that lately, the tendency have not been to make us pay for storage but for bandwith instead, which is what actually costs the most I think. But here it appears that the shortest contraint is over storage, even for their most expensive plan (30Gb << 100+ Gb for level 12 zoom only).
Yeah, for sure reducing zoom level will do part of the trick (I don't know about sea optimization, but that's an idea).
Well, hope I'll find a way around otherwise I'll probably have to setup my own postgis database.
I'll keep you updated.